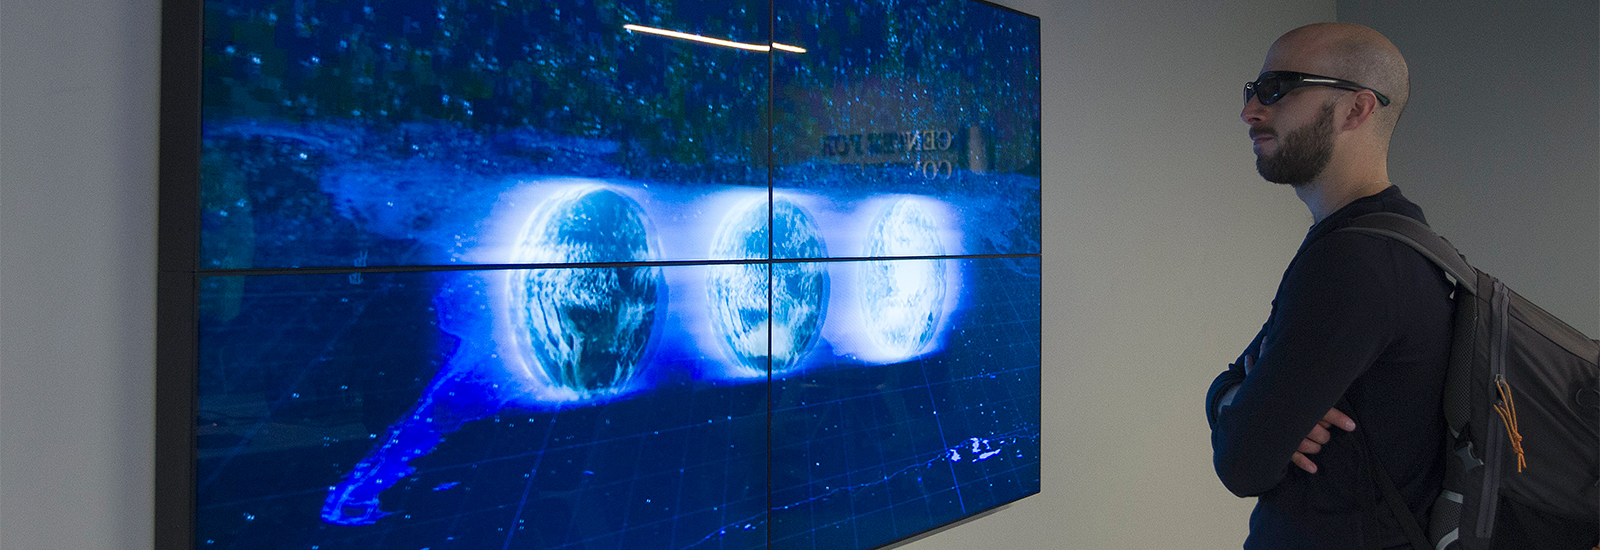
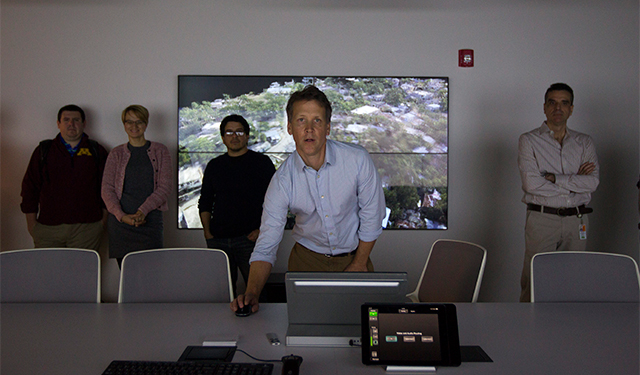
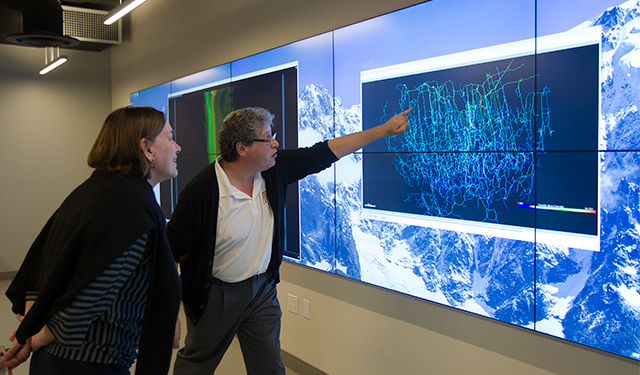
A tie-in with CCS’s Pegasus supercomputer makes that possible, allowing researchers to run simulations through the powerful device and then display their results on screen for analysis and discussion.
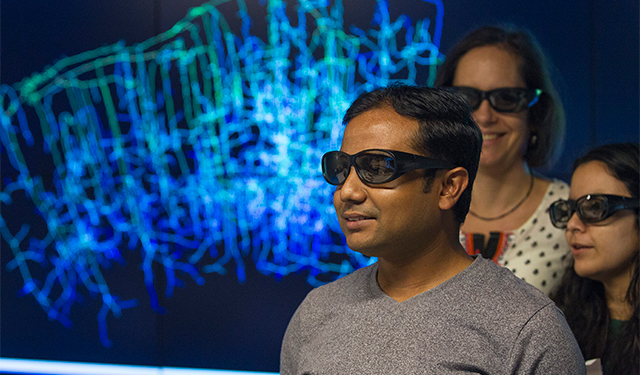
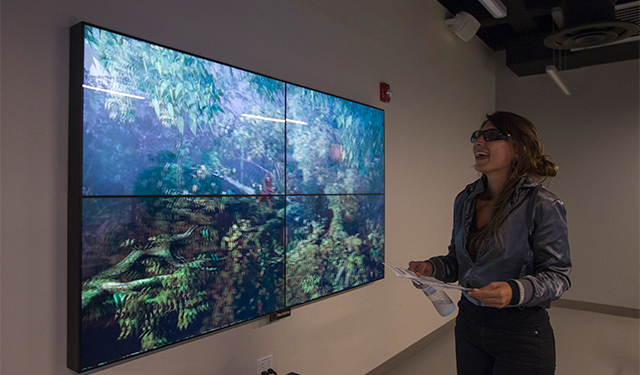
A plug-and-play system, the 2-D monitor is capable of displaying one large image or breaking up different components of data into as many as ten individual screens. A smaller 3-D monitor is also available, but content for that system must be specially created, and to experience the 3-D effect, special glasses must be worn.
Carie Penabad, associate professor in the School of Architecture, said she plans to use the Viz Lab at some point to present her ongoing research on shantytowns. With assistance from CCS, Penabad is using drones to map squatter settlements in Latin American countries such as Colombia and the Dominican Republic, using her charts to document and better understand those areas that are not included on the official maps of local governments yet are areas where hundreds of thousands of people live in horrid conditions.
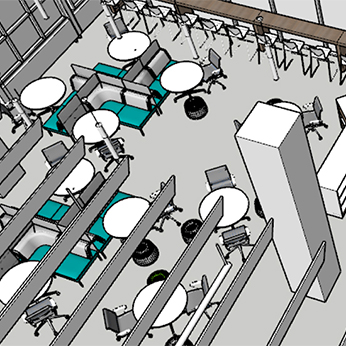
“I can see all kinds of incredible projects that will be related to what our graduate students do,” said Gina Maranto, director of the undergraduate program in ecosystem science and policy, who gathered some of her students to attend a demo session of the lab, located on the third floor of the Ungar Building.
“They do a lot, especially the students who are working on things like vector-borne diseases,” explains Maranto. “We have three or four students who have been doing visualization and looking at land cover and trying to correlate mosquito and land cover and dengue or malaria outbreaks. Compared to working on a little screen or even a fairly large Apple screen—this stuff [the Visualization Lab] is just incredible.”
The CCS Viz Lab is a free resource for the UM community, but first-time use of the space requires an orientation session with a CCS support team. For more information on training sessions, email vizlab@miami.edu.


